Kubernetes Windows Nodes

Introduction
On Day 1, after stepping stones and setting up a Kubernetes cluster, I was left wondering what to do next. Running mundane workloads on the cluster was definitely not the reason for setting it up in the first place. Instead, I aim to develop Kubernetes, specifically focusing on the Windows node components from this particular environment. In this post, I would like to share an experimental CLI tool created on SWDT (SIG Windows Dev Tools) that can assist in binary deployment and node configuration with simple syntax and standardized configurations.
Additionally, I aim to provide concise development workflows that I use daily for testing and validating the newly built custom components. The idea of this toolkit is to provide developers with more robust and reusable mechanisms, as opposed to shell scripts (which are perfectly fine), for managing Windows nodes remotely.
SIG Windows Development Environment
UPDATE: A new DEMO in pt-br can find here.
The SWDT repository contains the experiment/swdt folder for the POC CLI.
There’s a great documentation provided by Mateusz Loskot, on how to setup the same Windows cluster using Hyper-V in the project, check if this fits your use case. After compiling with make build, the binary will provide a few subcommands. Before looking at the command options, let’s explore the configuration format.
Settings
The configuration file has the following fields, and the passed to swdt with the flag --config.
apiVersion: windows.k8s.io/v1alpha1
kind: Node
metadata:
  name: sample
spec:
  credentials:
    username: Administrator
    hostname: 192.168.122.220:22
    privateKey:
  setup:
    enableRDP: true
    chocoPackages:
      - vim
      - grep
  kubernetes:
    provisioners:
      - name: containerd:
        version: 1.7.11
        sourceURL: http://xyz/containerd.exe
        destination: c:\Program Files\containerd\bin\containerd.exe
        overwrite: true
      - name: kubelet
        version: 1.29.0
        sourceURL: http://xyz/kubelet.exe
        destination: c:\k\kubelet.exe
        overwrite: true
- Credentials: support for SSH settings, it allows passing a password || privatekey path (neither is encrypted on this version)
- Setup: Define options for initial node bootstrap
- Kubernetes: Auxiliary Kubernetes binaries installation
Initial node setup
The initial setup as stated, will bootstrap the basic node settings and package installation required to help the developer to work inside the node, the functionalities right now are:
- Enable Remote Desktop Service
- Install Windows Choco Package Manager and a list of packages (vim, grep in the sample):

Kubernetes binaries locations and deployment
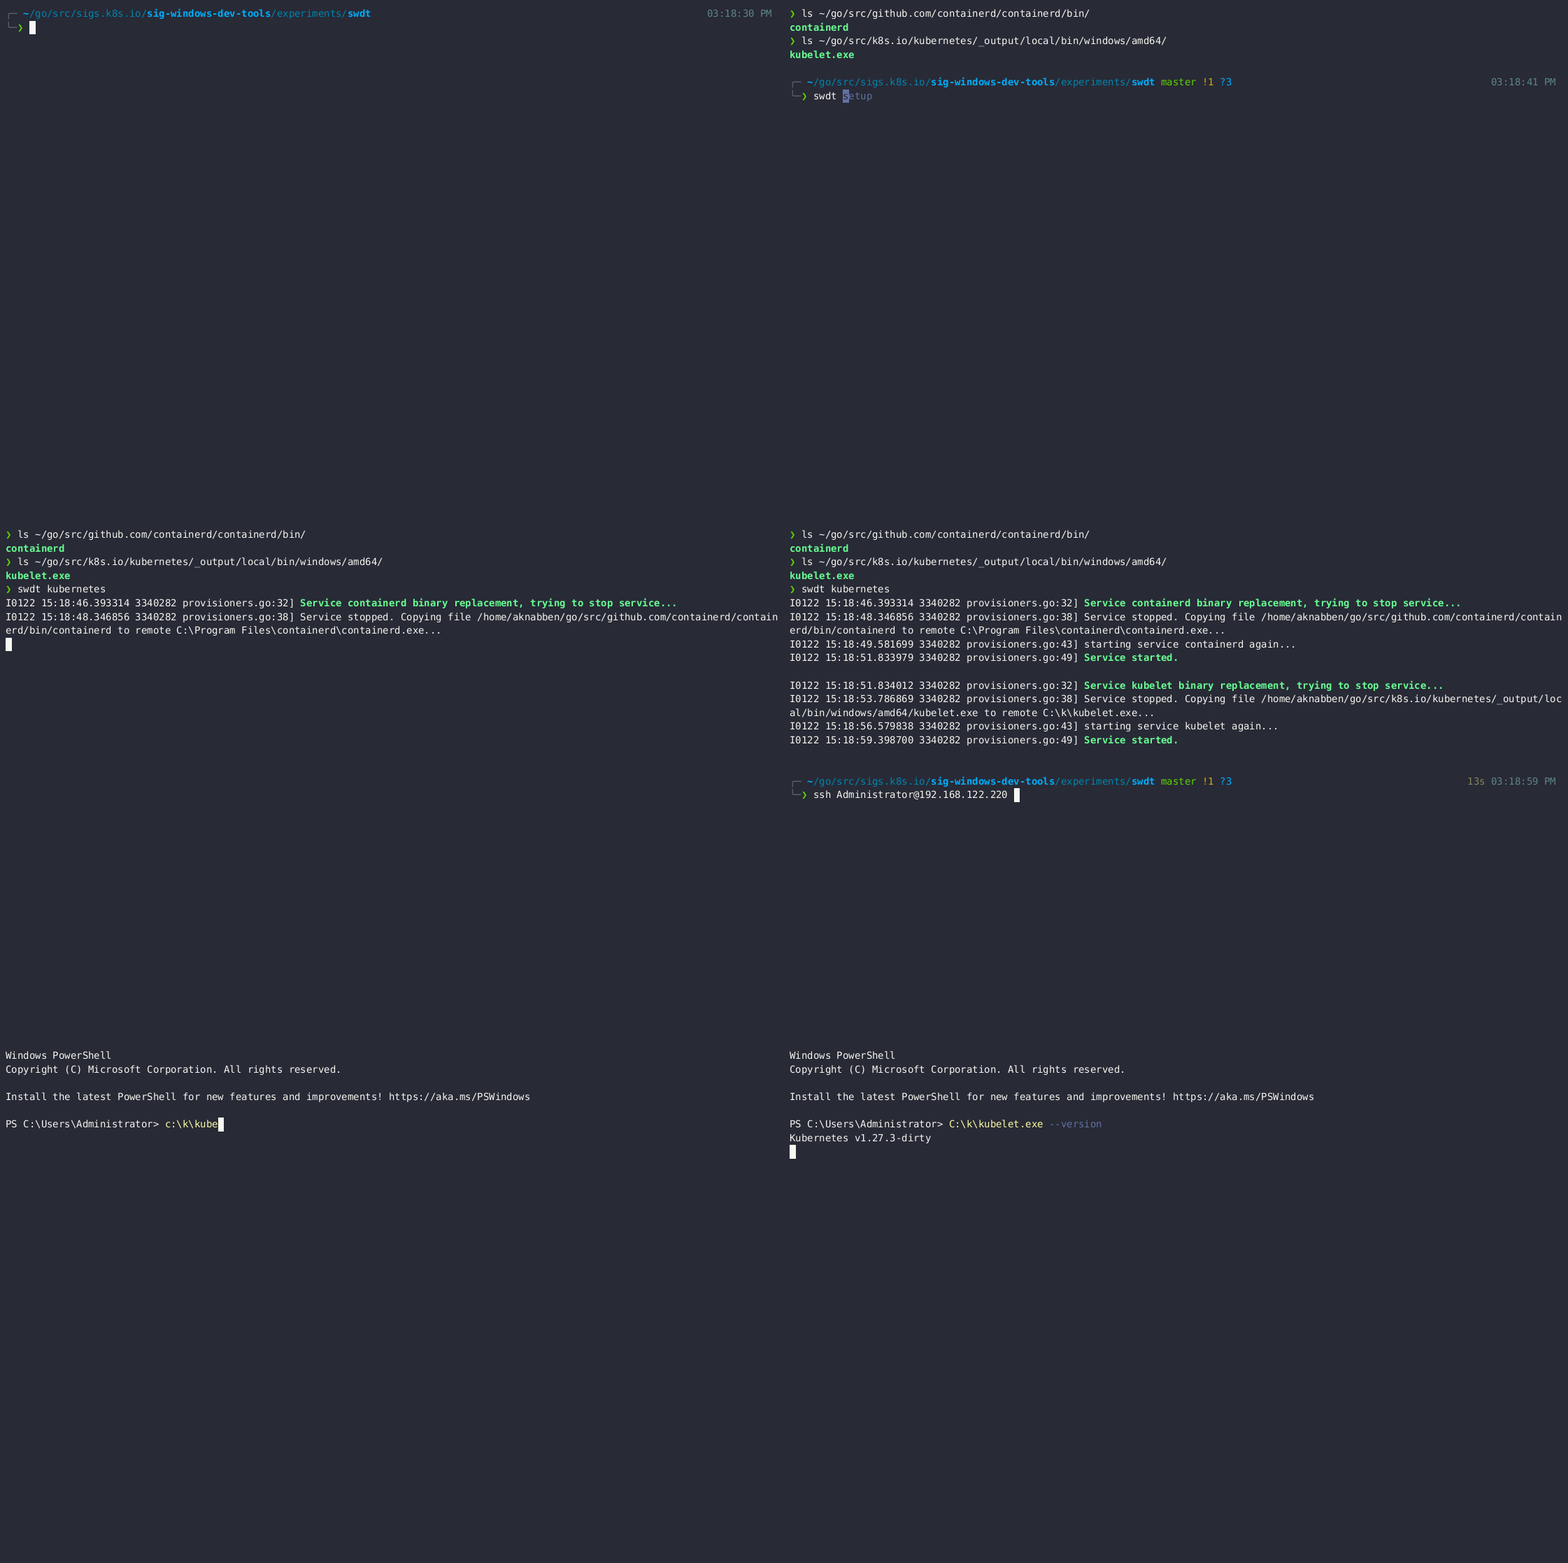
SWDT has developed the idea of provisioners, which are a list of objects used to replace specific binaries on your machine, mostly used to run against Kubernetes and Containerd services that have already been created in the Windows VM. This allows developers to compile a specific custom binary on their own machine, using the target architecture, and push it directly to the node. Having the Windows service automatically restarted afterward. This step significantly reduces the time required for replacing components at runtime on a Windows node while testing and developing them.
In the example the containerd and kubelet were both compiled with GOOS=windows in the Linux both GOPATH and uploaded to the running Windows node:

BONUS: Enabling tracing
The Containerd Windows service can be changed to enable logs and tracing, for more information about it look at this old post.
Deep diving on a real use case
CRI, gRPC connections and API
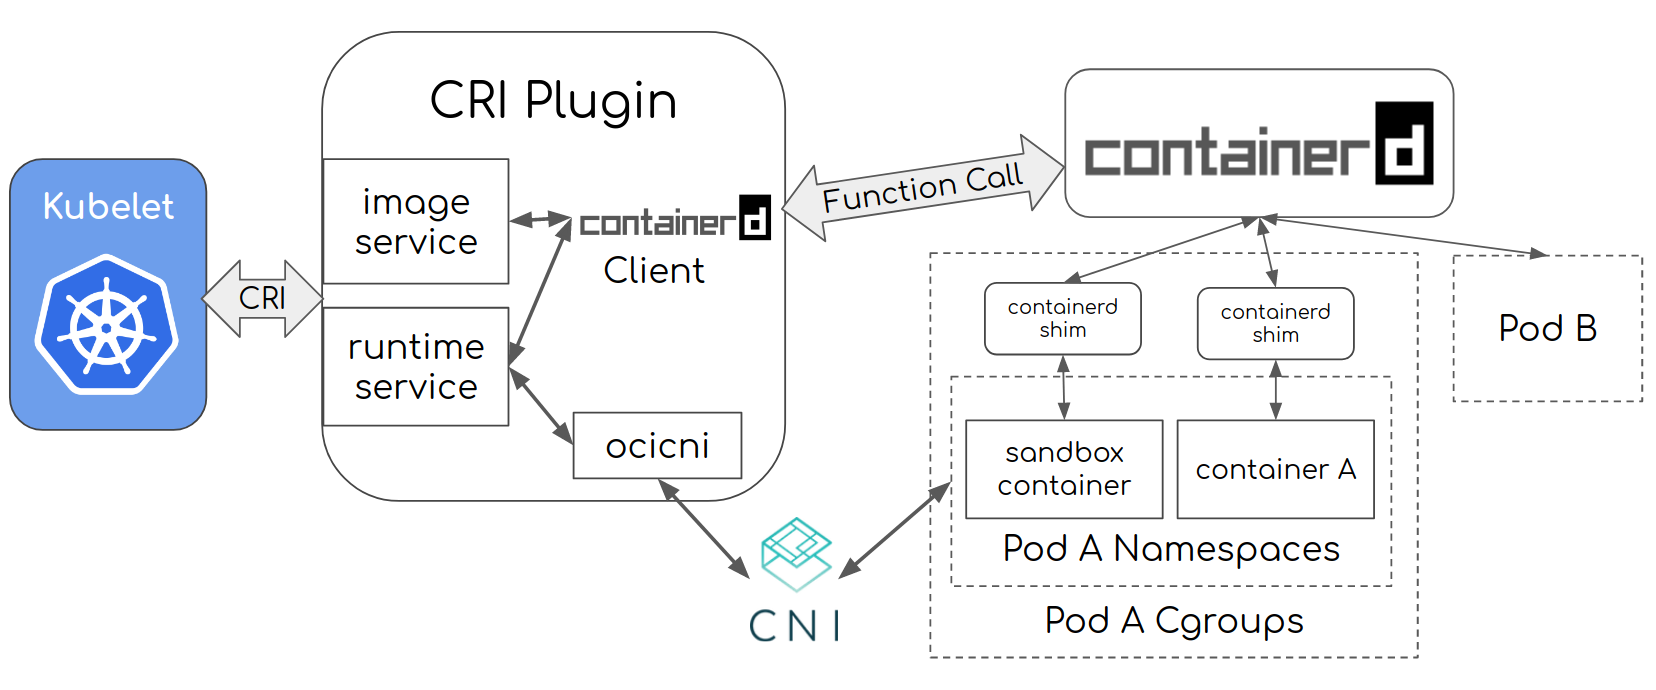
According to the official documentation, the CRI (Container Runtime Interface) is a plugin interface that allows the kubelet to utilize a wide range of container runtimes without requiring recompilation of the cluster’s components. Each node consists of a container runtime, and the kubelet can launch pods and their containers. CRI is the primary protocol for communication between the kubelet and container runtime (containerd, cri-o, etc.). This 2016 blog post states the CRI comprises of protocol buffer definitions, a gRPC API, and its own libraries. The kubelet itself is only a client and communicates with the container runtime (gRPC API server) through a Unix socket (locally bound).

The Kubernetes API has two services - RuntimeService and ImageService. To set the communication socket, kubelet uses two flags: --container-runtime-endpoint and --image-service-endpoint. The Runtime service has an interface for executables, attachments and port forwarding requests. It also provides interfaces for managing the lifecycle of a pod and providing statistics. The ImageService provides Remote Procedure Calls (RPCs) to pull an image from a repository, inspect it, and remove it.
// Runtime service defines the public APIs for remote container runtimes
service RuntimeService {
	...
    rpc RunPodSandbox(RunPodSandboxRequest) returns (RunPodSandboxResponse) {}
    rpc StopPodSandbox(StopPodSandboxRequest) returns (StopPodSandboxResponse) {}
    rpc RemovePodSandbox(RemovePodSandboxRequest) returns (RemovePodSandboxResponse) {}
    rpc PodSandboxStatus(PodSandboxStatusRequest) returns (PodSandboxStatusResponse) {}
    rpc ListPodSandbox(ListPodSandboxRequest) returns (ListPodSandboxResponse) {}
	...
}
// ImageService defines the public APIs for managing images.
service ImageService {
    rpc ListImages(ListImagesRequest) returns (ListImagesResponse) {}
    rpc PullImage(PullImageRequest) returns (PullImageResponse) {}
	...
}
To understand the entry point of the next journey, let’s first examine how we can practically access these endpoints. Kubelet serves as a client, so there isn’t much to observe here except for its client implementation (which we will revisit later, but for now we can access it using kubectl).
Containerd has a second layer that provides the CRI server API. This gRPC API is accessed through the CRI plugin, which is configured under the io.containerd.grpc.v1.cri section in the configuration file. The cri plugin utilizes containerd to manage the complete lifecycle of containers and all container images. Additionally, the cri plugin handles pod networking using CNI. To interact with the gRPC interface, you can use the crictl tool. For example, crictl can be used to list all pods or retrieve the stats of all pods on the node.
PS C:\Users\Administrator> crictl stats  -o table

CONTAINER           NAME                                                CPU %               MEM                 DISK                INODES
03f68fd87079e       cpulimittest-57aeaf8c-406e-4568-bba7-5ba86e390b04   44.81               121.1MB             37.75MB             0
c2cdaa1334388       cpulimittest-71a8a462-bfb6-4306-a1be-176f0266ebf1   53.41               121.5MB             37.75MB             0
To access the containerd directly you can still use ctr tool, for listing the images and sandbox pods running, it’s possible to do something like:
PS C:\Users\Administrator> ctr -n k8s.io task ls
TASK                                                                PID      STATUS
03f68fd87079e79116818242b12a9f4ba06510dae4740087f07a3adc97e207f3    24436    RUNNING


PS C:\Users\Administrator> Get-Process -Id 24436 | Format-table *

Name    Id PriorityClass FileVersion HandleCount WorkingSet PagedMemorySize PrivateMemorySize VirtualMemorySize TotalProcessorTime SI Handles            VM      WS       PM   NPM Path                                       Company      CPU ProductVersion Description Prod
                                                                                                                                                                                                                                                                          uct
----    -- ------------- ----------- ----------- ---------- --------------- ----------------- ----------------- ------------------ -- -------            --      --       --   --- ----                                       -------      --- -------------- ----------- ----
pwsh 24436        Normal                     573    3751936        40202240          40202240         613908480 00:00:02.5781250    5     573 2203932131328 3751936 40202240 50872 C:\Program Files\PowerShell\powershell.exe         2.578125
The last layer you want to access is the capability of creating a container directly in the Windows OS. The OCI provides a standard CLI tool called "runc" (used by “containerd” under the hood) to create the isolated process and resource-restricted process. When talking about Windows, things are different. There are no cgroups and namespaces like in Linux. Instead, Windows OSes implement the same isolation mechanisms via Job objects (cgroups) and Object Namespace (namespaces). The call happens directly on a subsystem called Host Compute Service (HCS), and the CLI in this case is called "runhcs".
This example demonstrates instead the use of a native Windows tool called: hcsdiag.exe to access the local containers running in the machine, for reading a file and executing commands in the container and operating with same functionalities as runhcs:
PS C:\Users\Administrator> hcsdiag read 03f68fd87079e79116818242b12a9f4ba06510dae4740087f07a3adc97e207f3 "c:\Windows\System32\drivers\etc\hosts"

# Kubernetes-managed hosts file.

127.0.0.1       localhost
::1     localhost ip6-localhost ip6-loopback
fe00::0 ip6-localnet
fe00::0 ip6-mcastprefix
fe00::1 ip6-allnodes
fe00::2 ip6-allrouters
192.168.15.167  cpulimittest-57aeaf8c-406e-4568-bba7-5ba86e390b04
PS C:\Users\Administrator> hcsdiag exec 03f68fd87079e79116818242b12a9f4ba06510dae4740087f07a3adc97e207f3 ipconfig

Windows IP Configuration

Ethernet adapter vEthernet (a9f5cf921ea270074c43af661312016dee9e7f5d59b949e6e21ce9a0a3846236_Calico):

Connection-specific DNS Suffix  . : cpu-resources-test-windows-7116.svc.cluster.local
Link-local IPv6 Address . . . . . : fe80::9055:ad42:5090:120f%45
IPv4 Address. . . . . . . . . . . : 192.168.15.167
Subnet Mask . . . . . . . . . . . : 255.255.255.192
Default Gateway . . . . . . . . . : 192.168.15.129
If you want to see more tricks related to this stack interaction these two videos are recommended:
- Kubernetes Is Not Magic III.: Kubelet, Containerd, CRI(-0) and runc
- Who’s Running My Pods? A Deep Dive into the K8s Container Runtime Interface - Phil Estes
CRI API and cAdvisor KEP
The CRI provides abstractions for container runtimes to integrate with Kubernetes. CRI expects the runtime to provide resource usage statistics for the containers. The cAdvisor library (an open-source project) previously provided information about CPU and memory. These exposed metrics were aggregated in the Summary API from Kubelet. With the adoption of CRI, all metrics are now aimed to be extracted from there.
The CPU, memory and filesystem information are gathered via these gRPC stubs:
service RuntimeService {
    rpc ContainerStats(ContainerStatsRequest) returns (ContainerStatsResponse) {}
    rpc ListContainerStats(ListContainerStatsRequest) returns (ListContainerStatsResponse) {}
    rpc PodSandboxStats(PodSandboxStatsRequest) returns (PodSandboxStatsResponse) {}
    rpc ListPodSandboxStats(ListPodSandboxStatsRequest) returns (ListPodSandboxStatsResponse) {}
}
From the Kubelet (using kubectl is possible to extract these metrics from a specific node):
$ kubectl get --raw "/api/v1/nodes/kind-control-plane/proxy/stats/summary”
There are more metrics than this sample, lets focus in the CPU for now:
 {
   "pods": {
      "podRef": {"name": "cpulimittest-57aeaf8c-406e-4568-bba7-5ba86e390b04"},
      "startTime": "2024-01-20T22:06:16Z",
      "containers": [
        {
          "name": "cpulimittest-57aeaf8c-406e-4568-bba7-5ba86e390b04",
          "startTime": "2024-01-20T22:06:18Z",
          "cpu": {
            "time": "2024-01-22T19:48:13Z",
            "usageNanoCores": 504720890,
            "usageCoreNanoSeconds": 82450187500000
          },
          "memory": {},
          "rootfs": {},
          "logs": {}
        }
      ],
      "cpu": {
        "time": "2024-01-22T19:48:13Z",
        "usageNanoCores": 504720890,
        "usageCoreNanoSeconds": 82450187500000
      },
      "memory": {},
      "network": {},
      "volume": []
    }
}
The primary problem we face is that the Container Runtime Interface (CRI) doesn’t offer sufficient data that includes the necessary specifications for both endpoints. This leads to confusion when a combination of cadvisor and CRI content is merged during the request, resulting in inconsistent metrics due to the different origins. The problem can escalate when various operating systems with different code paths are used.
A new KEP (Kubernetes Enhancement Proposal) was created to replace the cAdvisor metrics path and exclusively use the CRI (Container Runtime Interface) path. As part of this, the PodSandboxStats stub was created. Currently, the usage of this feature, which relies only on CRI, is in beta. You can test it by enabling the PodAndContainerStatsFromCRI feature gate.
When accessing the /stats/summary endpoint with the feature gate disabled, a request is made directly to the listPodStatsPartiallyFromCRI kubelet function.
func (p *criStatsProvider) listPodStats(ctx context.Context, updateCPUNanoCoreUsage bool) ([]statsapi.PodStats, error) {
    if p.podAndContainerStatsFromCRI {
        return p.listPodStatsStrictlyFromCRI(ctx, updateCPUNanoCoreUsage, containerMap, podSandboxMap, &rootFsInfo)
        if err == nil {
            return result, nil
        }
		// ...
    }
    return p.listPodStatsPartiallyFromCRI(ctx, updateCPUNanoCoreUsage, containerMap, podSandboxMap, &rootFsInfo)
}
The handler calls the listPodStats function on pkg/kubelet/stats/cri_stats_provider.go, the function calls getPodAndContainerMaps and uses the runtimeService to call Listcontainers and ListPodSandbox
The code function on listPodStatsPartiallyFromCRI then process the result and iterate merging the other values from cAdvisor:
func (p *criStatsProvider) listPodStatsPartiallyFromCRI(ctx context.Context, updateCPUNanoCoreUsage bool, containerMap map[string]*runtimeapi.Container, podSandboxMap map[string]*runtimeapi.PodSandbox, rootFsInfo *cadvisorapiv2.FsInfo) ([]statsapi.PodStats, error) {
    resp, err := p.runtimeService.ListContainerStats(ctx, &runtimeapi.ContainerStatsFilter{})  // ListContainerStats from CRI (containerd)
    allInfos, err := getCadvisorContainerInfo(p.cadvisor)
    caInfos, allInfos := getCRICadvisorStats(allInfos)

    for _, stats := range resp {
        p.addPodNetworkStats(ps, podSandboxID, caInfos, cs, containerNetworkStats[podSandboxID])
        p.addPodCPUMemoryStats(ps, types.UID(podSandbox.Metadata.Uid), allInfos, cs)
        p.addSwapStats(ps, types.UID(podSandbox.Metadata.Uid), allInfos, cs)
        p.addProcessStats(ps, types.UID(podSandbox.Metadata.Uid), allInfos, cs)
    }
}
OK, gRPC named pipes are not supported on grpcurl (the tool we are using to call the stub), lets use TCP instead in the c:\Program Files\containerd\config.toml configuration file, change these parameters:
[grpc]
  address = "\\\\.\\pipe\\containerd-containerd"
  gid = 0
  tcp_address = "192.168.122.220:8888"

[plugins]
    [plugins."io.containerd.grpc.v1.cri"]
        disable_tcp_service = false
This example shows how to directly fetch the Linux CRI endpoint using the Linux node instead on Containerd 1.7.12, using grpcurl:
$ grpcurl \
  -import-path ~/go/src/github.com/containerd/containerd/vendor/k8s.io/cri-api/pkg/apis/runtime/v1 \
  -import-path ~/go/src/github.com/containerd/containerd/vendor \
  -proto api.proto -plaintext 192.168.122.220:8888 \
  runtime.v1.RuntimeService/ListContainerStats
The ListContainerStats should return something like:
{
  "stats": {
      "attributes": {
        "metadata": {
          "name": "cpulimittest-57aeaf8c-406e-4568-bba7-5ba86e390b04"
        }
      },
      "cpu": {
        "timestamp": "1705956821372245000",
        "usageCoreNanoSeconds": {
          "value": "84401234375000"
        },
        "usageNanoCores": {
          "value": "407471100"
        }
      },
      "memory": {},
      "writableLayer": {}
  }
}
An interesting Containerd metric issue
Woof! That was a long ride! At least, from this point on, there is an understanding of how to swap hot binaries on Windows nodes in Kubernetes, and a general idea of how metrics are extracted from the runtime. So, let me tell you a story :)
The daily end-to-end (E2E) test, using the latest version of containerd, started encountering issues with a specific test, causing it to fail intermittently.
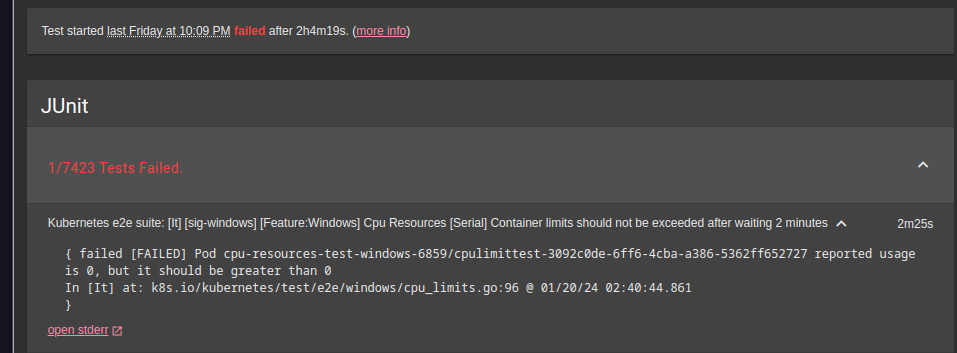
[It] [sig-windows] [Feature:Windows] Cpu Resources [Serial] Container limits should not be exceeded after waiting 2 minutes
If you examine the code base (located at k/k/test/e2e/windows/cpu_limits.go), the test begins by starting 2 pods with resource limits and a PowerShell job that will consume all available CPU for the isolated process. While the job is running, the test checks the CPU value at the /stats/summary endpoint. If the value is 0, which should never happen when the PowerShell script is running, it indicates a failure. This situation, as shown in the image, occasionally occurs.

This only happens on Containerd 1.7 daily test. The other test running on Containerd 1.6 never failed before. This never happens on Linux.
First steps is to replicate locally, I will the capability to recompile the containerd initially with these two different versions (1.6 and 1.7) and
run the same test upstream, let’s use the swdt provisioner:
$ cd ~/go/src/github.com/containerd/containerd/
containerd$ git checkout v1.7.12
containerd$ GOOS=windows make bin/containerd
containerd$ file bin/containerd
bin/containerd: PE32+ executable (console) x86-64, for MS Windows, 8 sections
containerd$ swdt kubernetes
The containerd service is restarted with the new binary, running the e2e.test confirms the issue. Makes sense now to emulate the test, the first thing we can do on a loop is start curling the /stats/summary endpoint as we did before and check the return:
$ while true; do kubectl get --raw "/api/v1/nodes/win-j9svr57644r/proxy/stats/summary"  | jq '.pods[] | [ .podRef.name,.cpu.usageNanoCores ] | @csv'; done | grep cpulimit
"\"cpulimittest-57aeaf8c-406e-4568-bba7-5ba86e390b04\",439449510"
"\"cpulimittest-71a8a462-bfb6-4306-a1be-176f0266ebf1\",503096265"
"\"cpulimittest-57aeaf8c-406e-4568-bba7-5ba86e390b04\",0"
"\"cpulimittest-71a8a462-bfb6-4306-a1be-176f0266ebf1\",0"
"\"cpulimittest-57aeaf8c-406e-4568-bba7-5ba86e390b04\",1506845973"
"\"cpulimittest-71a8a462-bfb6-4306-a1be-176f0266ebf1\",337382462"
"\"cpulimittest-57aeaf8c-406e-4568-bba7-5ba86e390b04\",0"
"\"cpulimittest-71a8a462-bfb6-4306-a1be-176f0266ebf1\",0"
Let’s recompile and push the latest changes to this branch to confirm that this unexpected behavior does not occur on version 1.6.
containerd$ git checkout v1.6.27
containerd$ GOOS=windows make bin/containerd
containerd$ swdt kubernetes

# Getting the /stats/summary endpoint again

"\"cpulimittest-57aeaf8c-406e-4568-bba7-5ba86e390b04\",500618452"
"\"cpulimittest-71a8a462-bfb6-4306-a1be-176f0266ebf1\",478772447"
"\"cpulimittest-71a8a462-bfb6-4306-a1be-176f0266ebf1\",478772447"
"\"cpulimittest-57aeaf8c-406e-4568-bba7-5ba86e390b04\",500618452"
"\"cpulimittest-71a8a462-bfb6-4306-a1be-176f0266ebf1\",478772447"
"\"cpulimittest-57aeaf8c-406e-4568-bba7-5ba86e390b04\",500618452"
Another way to retrieve this information directly from containerd is by using crictl stats -o json and confirming that the bug is not present in Kubelet. If you are curious enough (or still reading), take a look at the stats[].cpu.usageNanoCores on version 1.6 and note that the value is null. Yes, the runtime does not return this value on this containerd branch version, while version 1.7 returns an integer (although not always accurate, as mentioned).
If we deep dive in into the container_stats_list.go on containerd 1.6, there’s the stub code response for the (c *criService) ListContainerStats, Microsoft provides the stats from runhcs, and gives only the UsageCoreNanoSeconds: &runtime.UInt64Value{Value: wstats.Processor.TotalRuntimeNS}
you can see the code here. This returns nil in the ListContainerStatsResponse for the usageCoreNano field.
Some progress has been made in isolating the issue.
Before diving into the details, let’s first examine how Kubelet will handle this response and how containerd 1.6 will receive a value, to have a mental model of the entire stack.
To compile kubelet and add some klog for debugging and push the binary to the Windows node use:
$ make WHAT=cmd/kubelet KUBE_BUILD_PLATFORMS=windows/amd64
$ swdt kubernetes
Now in the Kubelet code, we saw before the listPodStatsPartiallyFromCRI extracts metrics, the function getAndUpdateContainerUsageNanoCores on Kubelet provides the first usageNanoCore metric to be cached.
This cache is stable and no matters how many requests in parallel I do, the value remains.
func (p *criStatsProvider) makeContainerStats(
        ...
		var usageNanoCores *uint64
		if updateCPUNanoCoreUsage {
			usageNanoCores = p.getAndUpdateContainerUsageNanoCores(stats)
		} else {
			usageNanoCores = p.getContainerUsageNanoCores(stats)
		}
		if usageNanoCores != nil {
			result.CPU.UsageNanoCores = usageNanoCores
		}
}
Coming back to the newer version (1.7.12) when I curl the /stats/summary endpoint, I observe throughout the Kubelet logs my path is not the same, all these functions are not accessible anymore, because we are now calculating this in the runtime and passing in the gRPC CRI response.
On 1.7 a new function was added to calculate the usageNanoCore field value that did not exist before, in the ListContainerStats function we now have:
func (c *criService) toCRIContainerStats(...) {

    if cs.Cpu != nil && cs.Cpu.UsageCoreNanoSeconds != nil {
        // this is a calculated value and should be computed for all OSes
        nanoUsage, err := c.getUsageNanoCores(cntr.Metadata.ID, false, cs.Cpu.UsageCoreNanoSeconds.Value, time.Unix(0, cs.Cpu.Timestamp))
        cs.Cpu.UsageNanoCores = &runtime.UInt64Value{Value: nanoUsage}
    }
}
If we jump into the getUsageNanoCore there seems to be an error in the calculation of the newUsageNanoCores variable. This was migrated from Kubelet, and it is expected that: currentUsageCoreNanoSeconds will be lower than oldStats.UsageCoreNanoSeconds.
However, when multiple operations are updating the containerStore cache concurrently, this may not be the case.
The inconsistency in behavior during testing may be caused by Kubelet or containerd calling the CRI API every 10 seconds.
func (c *criService) getUsageNanoCores(containerID string, isSandbox bool, currentUsageCoreNanoSeconds uint64, currentTimestamp time.Time) (uint64, error) {

    // oldStats comes from a previous cached value
    container, err := c.containerStore.Get(containerID)
    oldStats = container.Stats

	newUsageNanoCores := uint64(float64(currentUsageCoreNanoSeconds-oldStats.UsageCoreNanoSeconds) /
		float64(nanoSeconds) * float64(time.Second/time.Nanosecond))

}
The issue is open, and something is odd in the cache and its update function.
The saga continues…
Contribute
Now that you have all the tools to start hacking Kubernetes, are you interested in helping out with engaging challenges like this? Join the team on the Kubernetes Slack workspace #sig-windows channel and say hello!